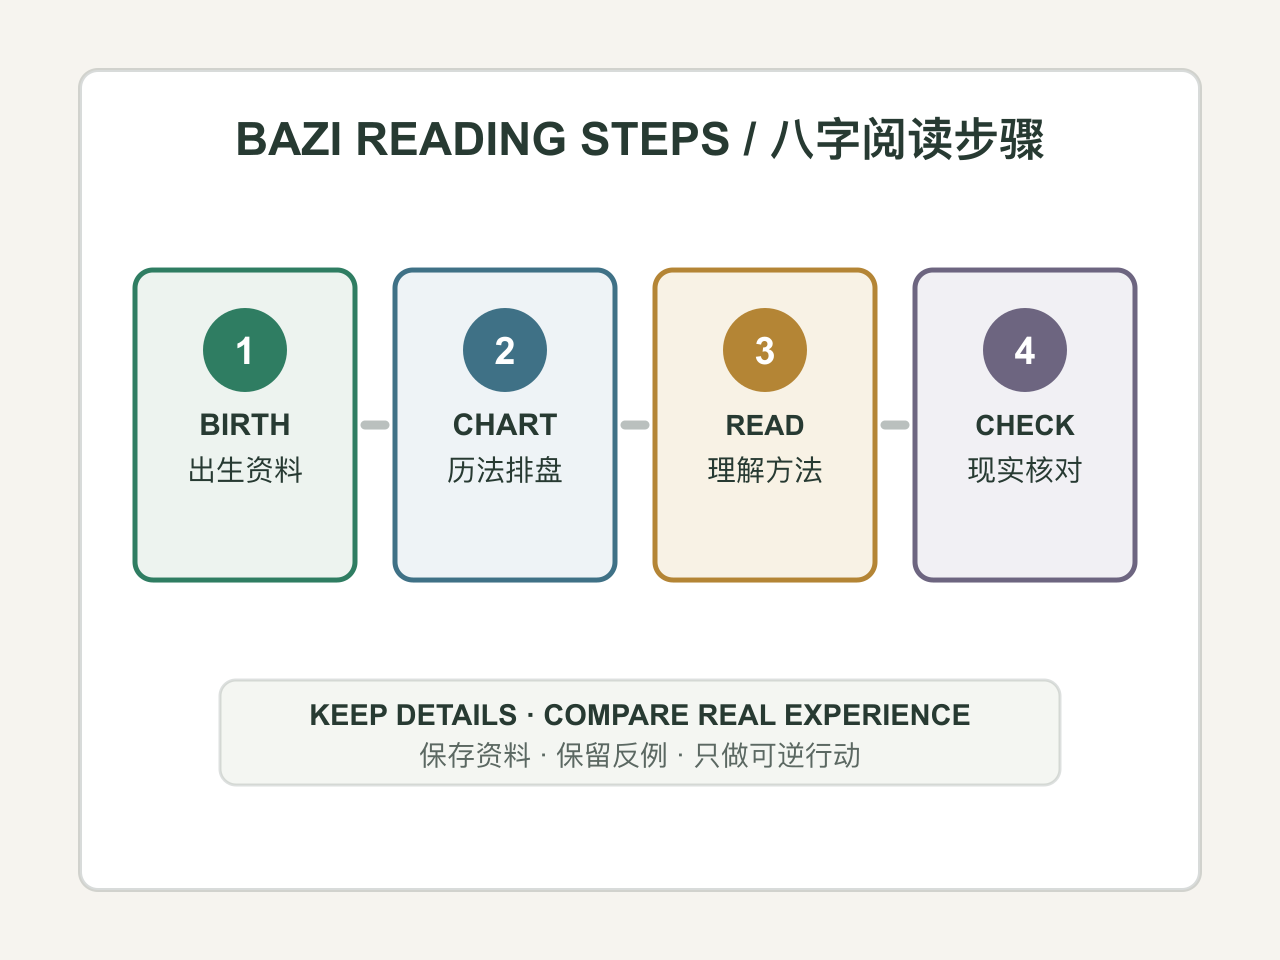
BaZi review path from birth input and chart calculation to method disclosure and real-world review

BaZi

Life Stage Reflection Chart

A visual guide to traditional BaZi age stages, designed to help you record yearly themes alongside real-life changes. The content is still being expanded, so this page currently focuses on the method.

Before you start

Prepare these details to see these results

Check which details are required before entering personal information. If something is missing, the page explains the effect instead of guessing for you.

What to prepare

  1. 1

    Name

    Labels the profile so the result remains understandable and distinguishable.

  2. 2

    Gender

    Applies method-specific rules and keeps the report wording appropriate.

  3. 3

    Birth date

    Establishes the calendar and timing data used by the calculation.

What you will see

What you need before you start

Before starting, confirm that dates, times, and other details are accurate, and note which items are required or optional. Do not replace missing required information with a guess.

Name

required

type in required

Labels the profile so the result remains understandable and distinguishable.

Example: Alex

What to enter: Remove accidental extra spaces and enter only the information requested.

If you leave it out: The tool cannot produce a reliable result without this required value.

Gender

choose optional

Applies method-specific rules and keeps the report wording appropriate.

Example: Female

What to enter: Choose one of the listed values; do not infer another person’s private information.

If you leave it out: The tool will continue with reduced detail and will not infer the missing value.

Birth date

required

date required

Establishes the calendar and timing data used by the calculation.

Example: 1990-06-15

What to enter: Use a valid calendar date that is not in the future.

If you leave it out: The tool cannot produce a reliable result without this required value.

Birth time

required

choose required

Adds the time pillar or time-dependent detail when the method supports it.

Example: Zi (23:00-01:00)

What to enter: Choose one of the listed values; do not infer another person’s private information.

If you leave it out: The tool cannot produce a reliable result without this required value.

How it works

This tool uses the details you enter on the page to produce a result. It is free to use, and your information is not sent to a third-party AI service.

Compare the curve with a real calendar

Mark actual deadlines, travel, health needs, family commitments, and recovery periods beside the symbolic curve. Use peaks and quieter segments only as prompts for preparation and review, not as forecasts. Revisit the chart monthly and record where reality disagreed; do not move a necessary medical, legal, financial, or work action solely because a line rises or falls.

Define the input before using the result

Use Life Stage Reflection Chart as a method record, not as an answer machine. Begin by writing the exact question, the input supplied, the date, and the convention used. The page concerns age stages, chart assumptions, yearly notes, life events, chronology, and non-predictive reflection; those terms have a history and may be defined differently by different schools. In a case such as a reader compares a traditional stage label with a work transition, preserve the original information before correcting or interpreting it. Label an input exact, reported, estimated, or unknown.

Read the output in context

After using Life Stage Reflection Chart, place the output beside the real question rather than reading it in isolation. For age stages, chart assumptions, yearly notes, life events, chronology, and non-predictive reflection, write one traditional association, one directly observable fact, and one ordinary explanation. This prevents a vivid label from becoming the only explanation for a complicated situation. If the input is near a calendar, time, character, or measurement boundary, show the alternative rather than hiding it.

A worked comparison

For a worked Life Stage Reflection Chart comparison, use age stages, chart assumptions, yearly notes, life events, chronology, and non-predictive reflection. Create two rows with the input, method, output, interpretation, uncertainty, cost, and review date. If two schools or dictionaries produce different results, preserve both results and explain the reason. Do not average them without a stated rule. A transparent comparison is more useful than a single impressive number.

Responsible use and consent

Use Life Stage Reflection Chart carefully when another person is involved. Ask permission before analysing a name, palm, chart, relationship, or shared space. Explain the method and allow the person to refuse. For age stages, chart assumptions, yearly notes, life events, chronology, and non-predictive reflection, avoid language that fixes identity, worth, health, compatibility, or destiny. Say traditionally associated, one school reads this as, or this input may suggest.

Review the record

At the review date, compare the original question with what was actually observed after using Life Stage Reflection Chart. Include inconvenient details, changed circumstances, and evidence that did not fit the reading. If the action helped, identify practical factors that may have contributed. If it did not help, revise or undo it instead of blaming the user or buying a more elaborate solution.

What this tool cannot establish

Life Stage Reflection Chart can support structured study of age stages, chart assumptions, yearly notes, life events, chronology, and non-predictive reflection, but it cannot establish a diagnosis, guarantee income, prove a relationship outcome, or determine a person’s fixed character. Its result depends on declared inputs and a chosen tradition. The page should make those dependencies visible beside the output.

A detailed worked case

A detailed case study for Life Stage Reflection Chart starts with a traditional stage label is compared with a work transition. Write the exact user question, input values, date, source, and convention. The tool can organise age stages, chart assumptions, yearly notes, life events, chronology, and non-predictive reflection, but its output is only as reliable as those declared assumptions. Preserve unknown or estimated information instead of silently filling it. Explain what each displayed field means in plain language and which later interpretation is optional.

Compare two results when a dictionary, calendar, time boundary, or measurement convention can change the output. Put the assumptions above the result, then list agreements, differences, and the practical evidence still needed. This prevents a number or label from sounding more authoritative than the method warrants.

Use one low-risk follow-up action: verify a source, repeat a measurement, ask the affected person, compare another assumption, or observe the situation for a fixed period. Keep the action reversible and record cost, consent, and review date. A change that follows a reading is not automatically caused by it; include ordinary factors and inconvenient results.

The tool is for cultural learning and structured reflection. It cannot diagnose health, guarantee income, determine compatibility, fix a person’s character, or replace professional advice. If the output creates fear or pressure to purchase, pause. The reader may disagree, seek another source, or stop.

A month-long reading and review

Read Life Stage Reflection Chart as a sequence of decisions rather than a score. Start with the user’s purpose and check whether the input is suitable for the method. Then inspect age stages, chart assumptions, yearly notes, life events, chronology, and non-predictive reflection in the order displayed. Write a short note explaining which field is directly calculated, which field comes from a lookup table, and which conclusion is added by interpretation. If the page uses a historical term, give its source context and avoid translating it into a modern promise.

A robust tool page gives the reader a way to challenge the result. Show the boundary cases, missing inputs, alternate calendar or dictionary rules, and the reason two outputs could differ. Ask another person to read the method without seeing the conclusion and note whether they can reproduce it. This is especially useful when the output looks precise but the underlying convention is uncertain.

For a month-long review, choose one ordinary question connected to the tool. Keep a dated record of the output, your expectation, the action taken independently, and what happened. Include events that do not fit. Do not change the input repeatedly until a preferred result appears. A result is a prompt for reflection, not evidence that the tool predicts a person’s future.

When the subject touches health, money, employment, law, safety, or relationship consent, move the decision to the relevant evidence and professional or shared process. Do not use the tool to pressure another person, justify a purchase, or create dependence. A reader should be able to save the method, disagree with the interpretation, and leave without penalty.

A yearly reflection page

Use the life-stage chart as a timeline for notes, not a graph of guaranteed fortune. For each year, record the displayed traditional stage, the actual work or family context, the decisions made, and the evidence you remember. Mark missing data and avoid rewriting an ordinary event to fit the line on the chart. The visual can help organise chronology while leaving causation open.

Review several years together only to find questions worth exploring. It cannot prove that a stage caused a promotion, loss, illness, or relationship change. Keep the chart beside ordinary records and use it for reflection, planning, and source comparison.

A timeline with uncertainty

Use the life-stage chart as a dated timeline, not a graph of guaranteed fortune. For each stage, record the traditional label, the chart assumptions, the actual work and family context, the decisions made, and the source of your memory. Mark years with incomplete information. When a line appears to match a promotion, move, illness, or relationship change, record ordinary causes and counterexamples before drawing a connection. The chart can help a reader notice questions across time, but it cannot establish that a stage caused an event. Review several entries together only to improve the next question. Keep the visualization beside ordinary records and allow the reader to reject the traditional framing. The useful output is a clearer chronology and a more deliberate plan, not a score that dictates what the next year must bring.

A final case note

A final lesson note about Life Stage Reflection Chart should connect the named method with a concrete case. Preserve the input, source, date, convention, and uncertainty, then describe the ordinary situation before applying specialist vocabulary. Compare the traditional interpretation with one practical explanation and state which conclusion remains unproven.

Use one small reversible exercise and set a review date. Record cost, consent, affected people, and what actually changed, including inconvenient results. If the topic touches health, money, law, safety, work, or relationship boundaries, use the relevant professional or shared process. The method supports cultural learning and reflection; it does not guarantee an outcome.

Is the K-line chart deterministic?

Yes. The preview uses deterministic BaZi-derived factors to generate the same chart for the same input, then adds explanatory text for easier reading.

Is this financial advice?

No. The chart uses market-style visuals only to help you see life rhythm more clearly. It works best as a planning reference, not as investment advice.

What should I do when real events do not match the curve?

Trust the real evidence. Record the mismatch, update the plan, and use the curve only as a reflection prompt. The visualization is not a probability model and should not be fitted after the fact by changing the meaning of each segment.

How do I prevent hindsight from changing the meaning of the curve?

Before the month begins, save the chart version and write the specific planning prompt, expected observation, and review date. At review, record what happened before reading a new explanation. Keep mismatches instead of renaming every peak or dip after the event. Compare the symbolic curve with the actual calendar, workload, health needs, finances, and family commitments. The chart is not a probability or financial model, so it must not delay necessary action or justify an irreversible decision.

Try next

Related tools